ST – Price Guard [Soothing Trades]Simple description
ST – Price Guard tracks prior days Highs and Lows, marks whether each level is Not Taken or Taken, and manages how long they stay on your chart.
Strong untouched levels become visually thicker and get "Strong" tags, while old or spent levels auto-expire based on clear rules.
Built for futures/FX and indices where correct session highs/lows actually matter.
Advanced description
This indicator turns "prior days Highs and Lows2, into a fully-managed system with state, age, and expiry instead of just two static lines.
What it does
Draws previous day's High and Low from raw price.
Lets you choose between:
• Calendar daily (D), or
• A custom trading day defined by session hours + time zone (ideal for futures/FX).
Stores each level with:
• Price
• High vs Low
• Birth day index
• Taken day index (if/when price closes beyond it)
Tracks status over time:
• NT (Not Taken) – level has not been "closed through" yet.
• Taken – level has been closed beyond; still visible for a grace period.
• Strong – untouched beyond a user-defined age threshold.
Visual features
Lines
• Separate color/width for YD High and YD Low.
• Line style: Solid/Dashed/Dotted.
• Extend: Right / Left / Both / None.
• Strong levels can get extra thickness for easy recognition.
Labels
Right-edge labels with:
• Custom text: e.g. "Price High" / "Price Low".
• Optional price appended.
• Shape: Right/Left/Circle/Diamond/Down.
• Horizontal offset in bars (park labels comfortably to the right).
• Vertical placement: Above, Below, or Auto (outside) plus adjustable offset in ticks.
Optional extra info:
• Status: NT or Taken
• Strong tag for aged, untouched levels
• Age / limit in days (e.g. age 3/10)
• Days left / grace (e.g. left 4d for NT, grace 1d after taken)
Label background tint also reflects state:
• Normal for NT,
• Slightly boosted for Strong,
• Faint for Taken.
Persistence logic
Price Guard is driven by explicit rules:
• Max keep days (not taken) – base lifetime for untouched levels.
• Strong at (days) – after this many days untouched, level becomes Strong.
• Extra keep if Strong – extends lifetime for strong levels.
• Keep after taken (extra days) – grace period to keep a Taken level visible.
A level is automatically deleted when:
• It is Not Taken and its age exceeds its allowed maximum, or
• It is Taken and the grace period is over.
No manual cleanup required – the chart maintains itself.
Inputs overview
• Price YD visibility: show/hide YD High and YD Low.
• Colors, widths, styles, and extend rules for YD lines.
• Label configuration: text, style, colors, right offset, vertical position, content toggles (NT/Taken, Strong, age, days left, price).
• Persistence rules: max keep days, strong threshold, strong bonus days, grace days after taken, extra width when strong.
• Session anchoring: custom trading day hours + time zone vs simple calendar D.
How traders use it
Build a daily playbook around YD High/Low without redrawing or guessing.
Quickly see which levels are:
• Fresh NT opportunities,
• Aged into Strong (high interest),
• Already Taken and in grace (lower priority).
Combine with:
• Reversion or breakout strategies around YD levels
• Liquidity grab concepts (sweeps around YD High/Low)
• Bias confirmation (e.g. both YD levels taken vs still intact).
Notes & disclaimer
• Works across most symbols/timeframes supported by Pine Script v6.
• Especially suited to futures/FX and indices with non-trivial sessions.
• For educational and analytical use only. This is not financial advice; always test and manage your own risk.
Cari skrip untuk "session high"

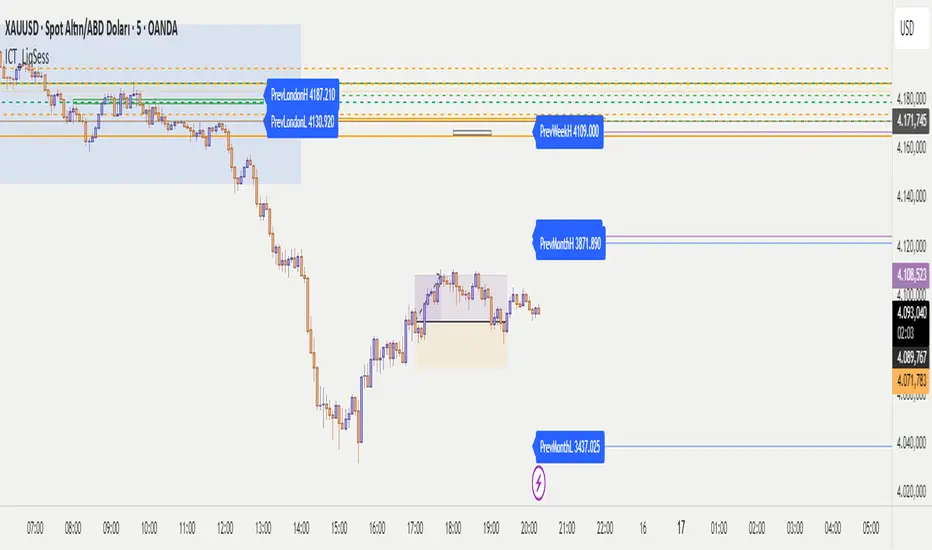
ICT - Liquidity & Sessions (Modular)ICT - Liquidity & Sessions (Modular)
A modular indicator for Inner Circle Trader (ICT) concepts, displaying liquidity zones, session levels, and key price levels.
Features:
Daily Levels:
Previous Day High/Low (PDH/PDL)
Previous Day Open/Close (PDO/PDC)
True Day Open (TDO) — NY 00:00
Current Day Open
Higher Timeframe Levels:
Previous Weekly High/Low
Previous Monthly High/Low
Session Analysis:
Session boxes: Asia, London, New York, Sydney, NY Lunch
Previous session High/Low for liquidity identification
Session open vertical lines
Session midlines (50% of session range)
Customization:
Toggle any level on/off
Customize colors, line styles, and widths
Adjustable session times (NY timezone)
Session box opacity control
Light mode option
Alerts:
Price crosses PDH/PDL
Price crosses Weekly/Monthly levels
Session open notifications
Performance:
Auto-cleanup of old lines/labels
Efficient drawing to prevent chart clutter
Modular design for easy customization
How to Use:
Add the indicator to your chart
Configure session times in the "Session Times (NY)" group
Enable/disable levels in the settings
Customize colors and styles to match your preference
Set up alerts for key level breaks
Perfect for:
ICT traders identifying liquidity zones
Session-based trading strategies
Multi-timeframe analysis
Identifying key support/resistance levels
Note: This indicator uses NY timezone for session calculations. Adjust session times in the settings to match your trading hours.
Dynamic Liquidity Levels [CDC Trading LABN] (ENGLISH)Script Description :
Take your market structure and liquidity analysis to the next level with Dynamic Liquidity Levels, a professional-grade tool designed to visualize the key levels that truly move the price. This indicator doesn't just plot static lines; it offers a dynamic framework that reacts to price action in real-time, keeping your chart clean and focused on what matters.
Designed for scalpers and swing traders alike, this indicator is your map for navigating market liquidity.
Key Features
• Smart Dynamic Lines: The standout feature of this indicator. Lines automatically stop extending once price has "invalidated" them. You decide whether the break occurs on a simple wick touch (to capture liquidity grabs) or a full candle close beyond the level (for a stronger confirmation).
• Comprehensive Liquidity Levels: Automatically draws the most important liquidity pools that professional traders watch every day:
• HTF Levels: Previous Day, Week, and Month Highs & Lows (PDH/L, PWH/L, PMH/L).
• Session Levels: Asian, London, and New York Session Highs & Lows (ASH/L, LSH/L, NYH/L).
• Full Label Control: Forget about overlapping labels. Adjust the position of each label individually (Left, Right, Center, Upper, Lower) for perfect visual clarity in any market condition.
• Instant, Configurable Alerts: Never miss an opportunity. Set up alerts that trigger the moment a level of your choice is broken, helping you execute your trades with precision.
• Clean & Professional Visualization: Fully customizable. Adjust colors, line width, and decide whether to display exact prices in the labels for an analysis setup tailored to your style.
Who is This Indicator For?
This tool is essential for a wide range of trading methodologies:
• Smart Money Concepts (SMC) & ICT Traders: Perfect for identifying liquidity pools and draw on liquidity levels. Use it to frame your order blocks and points of interest.
• Candle Range Theory (CRT) Traders: This indicator automates the core of your analysis. It identifies and projects the key candle ranges from higher timeframes (Daily, Weekly, Monthly) and trading sessions. Use these levels to anticipate price expansion and identify liquidity targets above and below established ranges, without manual markup every day.
• Price Action Traders: Clearly and automatically visualize the most relevant support and resistance levels based on high-timeframe market structure.
• Day Traders & Scalpers: Make quick decisions based on previous day's levels and session highs/lows, which act as magnets for intraday price.
• Swing Traders: Use the weekly and monthly levels to get a macro view of the structure and plan longer-term trades.
How to Use
1. Add the indicator to your chart.
2. Explore the settings panel to enable the levels and alerts that fit your trading plan.
3. Adjust the label positions for maximum clarity.
4. To receive alerts, right-click on the chart, create a new alert, select the indicator from the dropdown, and choose the "Any alert() function call" option.
We hope this tool greatly helps you improve your market analysis.
Happy trading!
CDC Trading LABN

Dynamic Liquidity Levels [CDC Trading LABN] (ESPAÑOL)Script Description :
Take your market structure and liquidity analysis to the next level with Dynamic Liquidity Levels , a professional-grade tool designed to visualize the key levels that truly move the price. This indicator doesn't just plot static lines; it offers a dynamic framework that reacts to price action in real-time, keeping your chart clean and focused on what matters.
Designed for scalpers and swing traders alike, this indicator is your map for navigating market liquidity.
Key Features
• Smart Dynamic Lines: The standout feature of this indicator. Lines automatically stop extending once price has "invalidated" them. You decide whether the break occurs on a simple wick touch (to capture liquidity grabs) or a full candle close beyond the level (for a stronger confirmation).
• Comprehensive Liquidity Levels: Automatically draws the most important liquidity pools that professional traders watch every day:
• HTF Levels: Previous Day, Week, and Month Highs & Lows (PDH/L, PWH/L, PMH/L).
• Session Levels: Asian, London, and New York Session Highs & Lows (ASH/L, LSH/L, NYH/L).
• Full Label Control: Forget about overlapping labels. Adjust the position of each label individually (Left, Right, Center, Upper, Lower) for perfect visual clarity in any market condition.
• Instant, Configurable Alerts: Never miss an opportunity. Set up alerts that trigger the moment a level of your choice is broken, helping you execute your trades with precision.
• Clean & Professional Visualization: Fully customizable. Adjust colors, line width, and decide whether to display exact prices in the labels for an analysis setup tailored to your style.
Who is This Indicator For?
This tool is essential for a wide range of trading methodologies:
• Smart Money Concepts (SMC) & ICT Traders: Perfect for identifying liquidity pools and draw on liquidity levels. Use it to frame your order blocks and points of interest.
• Candle Range Theory (CRT) Traders: This indicator automates the core of your analysis. It identifies and projects the key candle ranges from higher timeframes (Daily, Weekly, Monthly) and trading sessions. Use these levels to anticipate price expansion and identify liquidity targets above and below established ranges, without manual markup every day.
• Price Action Traders: Clearly and automatically visualize the most relevant support and resistance levels based on high-timeframe market structure.
• Day Traders & Scalpers: Make quick decisions based on previous day's levels and session highs/lows, which act as magnets for intraday price.
• Swing Traders: Use the weekly and monthly levels to get a macro view of the structure and plan longer-term trades.
How to Use
1. Add the indicator to your chart.
2. Explore the settings panel to enable the levels and alerts that fit your trading plan.
3. Adjust the label positions for maximum clarity.
4. To receive alerts, right-click on the chart, create a new alert, select the indicator from the dropdown, and choose the "Any alert() function call" option.
We hope this tool greatly helps you improve your market analysis.
Happy trading!
CDC Trading LABN

Lightning Session LevelsLightning Session Levels (LSL) draws clean, non-repainting levels for the major market sessions and a compact HUD in the top-right corner. It’s built to be lightweight, readable, and “set-and-forget” for intraday traders.
What it shows
Session High/Low and Open/Close levels for:
ASIA (00:00–08:00 UTC)
EUROPE (07:00–16:00 UTC)
US (13:30–20:00 UTC)
OVERNIGHT (20:00–24:00 UTC)
HUD panel:
Current active session
Countdown to the next US session (auto-calculated from UTC)
How it works (non-repainting)
Levels are anchored at session close. Each line is created once on the confirmed closing bar of the session (x2 = session end).
Optional Extend Right keeps the level projecting forward without changing the anchor (no “drifting”).
All drawings are pinned to the right price scale for stable reading.
Inputs
Show HUD — toggle the top-right panel.
Show Levels — master switch for drawing levels.
Draw High/Low — H/L session levels.
Draw Open/Close — O/C session levels.
Extend Right — extend all session lines to the future.
Keep N past sessions per market — FIFO limit per session group (default 12).
ASIA / EUROPE / US / OVERNIGHT — enable/disable specific sessions.
Style & palette
Consistent “Lightning” colors:
ASIA = Cyan, EUROPE = Violet, US = Amber, OVERNIGHT = Teal
Labels are always size: Normal for readability.
HUD uses a dark, subtle two-tone background to stay out of the way.
Recommended use
Timeframes: intraday (1m → 4h).
On 1D and higher, TradingView’s session-window time() filters won’t match intraday windows, so levels won’t plot (by design).
Markets: crypto, indices, FX, equities — any symbol where intraday session context helps.
Notes & limitations
Fixed UTC windows. The US window is set to 13:30–20:00 UTC. Daylight-saving shifts (DST) are not auto-adjusted; if you need region-specific DST behavior, treat this as a consistent UTC model.
The HUD timer counts down to the next US open from the current UTC clock.
Draw limits are capped (500 lines, 500 labels) for performance and stability.
Quick start
Add Lightning Session Levels to your chart.
Toggle Draw High/Low and/or Draw Open/Close.
Turn on Extend Right if you want the levels to project forward.
Enable only the sessions you care about (e.g., just EUROPE and US).
Use Keep N past sessions to control clutter (e.g., 6–12).
Disclaimer
This tool is for educational/informational purposes only and is not financial advice. Past session behavior does not guarantee future results. Always manage risk.

FVG Session Break Strategy with ATR RR🧠 FVG Session Break Strategy with ATR RR — Timezone-Aware, Session-Savvy, and Risk-Calibrated
This strategy captures high-probability reversals and continuations by combining Fair Value Gap (FVG) imbalances with session-based breakout logic and ATR-calibrated risk management. It’s designed for traders who want to exploit structural inefficiencies during key market sessions — with precision and portability across global exchanges.
🔍 Core Logic:
Fair Value Gap Detection: Identifies bullish and bearish FVGs using a 3-bar displacement pattern.
Session Breakout Engine: Tracks session highs and lows (Asian, London, NY) and triggers trades only when price breaks these levels — ensuring trades occur at meaningful inflection points.
ATR-Based RR Control: Dynamically sizes stop-loss and take-profit levels using ATR × multiplier, maintaining consistent risk across volatility regimes.
🌐 Timezone-Aware Session Logic:
Session boundaries are defined in UTC-5 (e.g., NY: 0930–1600) but automatically converted to the exchange’s local timezone using timestamp("Etc/GMT+5", ...). This ensures:
Accurate session detection across all markets and assets
No manual timezone adjustments needed
Robust performance on crypto, forex, and global equities
📈 Visuals:
Session highs and lows plotted in orange
Bullish and bearish FVGs marked with green and red triangles
Strategy entries and exits shown on chart with full RR logic
This strategy is ideal for traders who want to combine structural edge with session context and disciplined risk.

ORB Breakout Strategy w/ Filters - Dynamic Sizing - MTFHere is a comprehensive description of the strategy, written in a clear and structured format. You can use this for your script's "how-to-use" guide or documentation.
---
## 📈 Opening Range Breakout (ORB) Strategy
This is a comprehensive, multi-timeframe strategy built for trading opening range breakouts. It is designed with a "filters-first" approach, allowing you to validate a breakout with trend, volume, and volatility.
The strategy's core power comes from its flexibility. You can trade on a low timeframe (like a 1-minute chart) while basing your breakout levels on a higher timeframe's opening bar (e.g., the first 15-minute bar). It includes dynamic position sizing based on risk and a wide array of advanced exit management options.
### Key Features
* **Multi-Timeframe Opening Range:** The core of the strategy. You can define the "Opening Range" timeframe (5, 10, 15, 30, or 60 min) *independently* of your chart timeframe.
* **Custom Trading Session:** Define the exact session (e.g., "0930-1600" in "America/New_York") you want to trade.
* **One Trade Per Session:** The strategy will only take the *first valid breakout* signal per day to avoid over-trading.
---
### 🚦 Entry Signals & Filters
A trade is only initiated when the price closes above the Session High or below the Session Low **AND** all active filters are passed.
* **Trend Filter:** (Optional) Requires price to be above a long-term MA (e.g., 100 EMA) for long trades and below it for short trades.
* **Volume Filter:** (Optional) Requires the breakout bar's volume to be a specified multiplier (e.g., 1.5x) of the recent average volume.
* **Volatility Filter:** (Optional) Requires the current ATR to be higher than its long-term average, ensuring you only trade during periods of expanding volatility.
* **Direction Filter:** Allows you to isolate the strategy to **Long Only**, **Short Only**, or **Both**.
---
### 💰 Dynamic Position Sizing
The strategy includes a robust "Risk %" sizing model.
* **Risk-Based Sizing:** Instead of fixed contracts, it calculates the position size based on your **Account Size**, **Risk % per Trade**, and the **Stop Loss distance**.
* **Auto-Detect Point Value:** It automatically detects the correct point value for popular futures contracts (ES, NQ, MES, MNQ) and provides a manual override for other assets.
---
### 📤 Exit & Risk Management
This strategy features a multi-layered exit system, giving you complete control over how trades are managed.
#### 1. Stop Loss (SL)
Your initial stop loss can be calculated using a fixed **Tick** offset or an **ATR** multiplier. It can be anchored from two different points:
* **Breakout Level:** The stop is placed relative to the `sessionHigh` or `sessionLow` level.
* **Entry Bar:** The stop is placed relative to the high/low of the bar that *triggered* the entry.
#### 2. Take Profit (TP)
A standard Take Profit can be set using a fixed **Tick** offset or an **ATR** multiplier.
#### 3. Advanced Exit Logic
These options override the standard Take Profit to allow for more dynamic trade management:
* **Trailing Take Profit (TTP):**
* **Fixed/ATR Trail:** A standard trailing stop that activates after price moves a certain amount in your favor.
* **MA Price Cross:** Exits the trade as soon as the price closes across a fast-moving average (e.g., 9-EMA).
* **MA Crossover:** Exits the trade as soon as a fast MA crosses below a slow MA (for longs) or above (for shorts).
* **Close on Reversal:** (Optional) Exits immediately if the **very next bar** after entry closes back *inside* the opening range (a "failed breakout" signal).
* **Close on Opposite Range Cross:** (Optional) Exits a long trade if the price ever closes below the `sessionLow` (and vice-versa for shorts).
* **End of Session Exit:** All open positions are automatically closed at the end of the defined trading session.

The Machine – Session Map PRO (final)The Machine – Session Map
Overview
The Machine – Session Map is a session-based analytical indicator that divides the trading day into the three main global sessions — Asia, London, and New York — and maps their price behavior using structured logic. It’s designed for traders who study intraday cycles, session liquidity behavior, and inter-session relationships.
Core Logic
The indicator identifies the start and end times of each major trading session based on user-defined session times. For every session, it:
Captures session range by recording the high, low, and close between session start and end.
Stores previous session data and projects key levels (previous session high, low, and midpoint) into the next day as reference support/resistance zones.
Computes pip range and volatility metrics per session to measure strength and expansion.
Determines directional bias by comparing the session’s close relative to its open and prior session range (expansion above or below prior structure defines bias).
Detects accumulation and distribution zones using session overlap logic and range compression/expansion criteria.
Labels session structures with automatic annotations such as “Expansion,” “Retracement,” or “Reversal” when volatility or bias conditions are met.
Visual Elements
Session Boxes: Colored regions that visually segment the chart into the three sessions.
High/Low Lines: Dynamic lines showing real-time session highs and lows as price develops.
Previous Session Levels: Optional projection of previous highs/lows/midpoints as structural zones.
Bias Labels: Text markers summarizing session direction and volatility conditions.
Dashboard Panel: Displays current session time, range in pips, and directional bias summary.
Use Case
This tool is useful for identifying intraday structure shifts, comparing session volatility, and observing how price behaves relative to prior session levels. It can support strategies involving session-based liquidity cycles, accumulation/manipulation/distribution behavior, or time-based confluence.
Disclaimer
This indicator is designed for technical and educational analysis. It does not generate buy/sell signals or provide financial advice.

Session Liquidity Levels – Indicator for Smart Day Traders🧭 Session Liquidity Levels – Indicator for Smart Day Traders
Identify Key Market Liquidity Zones with Precision
The Session Liquidity Levels indicator automatically plots the most important market levels every day — giving you a clear view of where liquidity is building and where potential reversals or breakouts can occur.
This tool is designed for traders who rely on session structure and clean market levels rather than noise or lagging indicators.
⚙️ Features
✅ Asia Session High & Low – See the overnight range where liquidity starts building.
✅ London Session High & Low – Track the major volatility window and identify sweeps or fakeouts.
✅ Previous Day High & Low – Key reference points for continuation or reversal plays.
✅ Custom Colors & Styling – Personalize line colors and styles to fit your chart theme.
✅ Lightweight & Fast – Built in Pine Script v5 for smooth performance on all assets.
📊 How It Helps
Quickly visualize session highs/lows to plan liquidity grabs or breakout entries.
Mark daily structure without manually drawing lines.
Combine with your existing strategy to refine entry and exit timing.
Works on Forex, Indices, and Metals across all intraday timeframes.
⚡ Best For
Day traders who use session-based strategies (like Asia → London → New York transitions).
Traders studying liquidity sweeps, breakouts, or market structure shifts.
Anyone who wants a clean, automatic way to see session boundaries and key highs/lows.
🕌 Ethical Note
This indicator is 100% original, independently coded, and inspired by common trading concepts such as session ranges and daily structure.
It is not affiliated with or copied from any other paid indicators.
💰 Access
Available as an Invite-Only Script on TradingView.
Once purchased, you’ll receive access within 24 hours.
📩 Support
If you have any issues or want custom modifications (extra sessions, alerts, etc.), contact me directly — I’ll help you set it up.
Trade smarter. Stay disciplined. Let your levels guide you.

iFVG Strategie by Futures.RobbyiFVG Strategy Checklist by Futures.Robby
Updated: October 27, 2025
Description
This script is a manual checklist designed to help traders evaluate their setups based on the iFVG (Fair Value Gap) strategy. It serves solely as a visual aid and does not perform automatic analysis, signal generation, or trade execution.
How It Works
The script creates an interactive checklist directly on the chart. Traders manually select which criteria are met, and the script calculates a percentage score, displaying it with color coding:
Green (≥ 60%): Good fulfillment of criteria
Orange (40–59%): Partial fulfillment
Red (< 40%): Poor fulfillment
Checklist Criteria
The checklist is divided into two main sections:
1. Trade Criteria (8 Points)
Eight manually selectable criteria to assess setup quality:
Trade im Bias → Trade in Bias: Trade follows the higher timeframe trend (H1/H4/Daily).
BE Level → BE Level: Swing point between entry and target.
Sweep → Sweep: Price hits a key swing before reversing.
Displacement → Displacement: iFVG broken by strong candles.
Leg FVG geschlossen → Leg FVG Closed: No open m1 to m5 FVGs to target.
FVG Reaktion → FVG Reaction: Reaction at FVG during sweep (HTF).
FVG Größe → FVG Size: 6 to 10 points.
Anzahl Kerzen → Number of Candles: Maximum of 6 candles.
2. Goals (1 Point)
Six optional goal conditions, counted together as 1 point:
Equal H / L → Equal High/Low
Session H / L → Session High/Low
News H / L → News High/Low
HTF Swing Point → HTF Swing Point
HTF OB → HTF Order Block
HTF FVG → HTF FVG
Settings and Customization
The script’s settings are translated as follows:
Group: Trade Criteria
Trade im Bias → Trade in Bias
Tooltip: Trendrichtung folgt HTF (H1/H4/Täglich) – Trend follows HTF direction
BE Level → BE Level
Tooltip: Swingpunkt zwischen Einstieg und Ziel – Swing point between entry and target
Sweep → Sweep
Tooltip: Kurs erreicht markanten Swing – Price hits key swing before inverse
Displacement → Displacement
Tooltip: iFVG durch starke Kerzen gebrochen – iFVG broken by strong candles
Leg FVG geschlossen → Leg FVG Closed
Tooltip: Keine offenen m1 bis m5 FVGs bis Ziel – No open m1 to m5 FVGs to target
FVG Reaktion → FVG Reaction
Tooltip: Reaktion an FVG beim Sweep (HTF) – Reaction at FVG during sweep (HTF)
FVG Größe → FVG Size
Tooltip: 6 bis 10 Punkte – 6 to 10 points
Anzahl Kerzen → Number of Candles
Tooltip: Maximal 6 Kerzen – Maximum of 6 candles
Group: Goals
Equal H / L → Equal High/Low
Session H / L → Session High/Low
News H / L → News High/Low
HTF Swing Point → HTF Swing Point
HTF OB → HTF Order Block
HTF FVG → HTF FVG
ℹ️ Ziele zählen gemeinsam als 1 Punkt → ℹ️ Goals count together as 1 point
Window Position & Size
Fensterposition → Window Position
oben rechts → top right
oben links → top left
unten rechts → bottom right
unten links → bottom left
Tabellengröße → Table Size
normal → normal
small → small
tiny → tiny
Translation of Chart Table Contents
The table headers and entries on the chart are translated as follows:
Table Headers:
Trade Checkliste → Trade Checklist
Ziele → Goals
Status Symbols:
✅ → ✅ (Fulfilled)
❌ → ❌ (Not fulfilled)
Individual Criteria (Trade Criteria):
Trade im Bias → Trade in Bias
BE Level → BE Level
Sweep → Sweep
Displacement → Displacement
Leg FVG geschlossen → Leg FVG Closed
FVG Reaktion → FVG Reaction
FVG Größe → FVG Size
Anzahl Kerzen → Number of Candles
Individual Criteria (Goals):
Equal H / L → Equal High/Low
Session H / L → Session High/Low
News H / L → News High/Low
HTF Swing Point → HTF Swing Point
HTF OB → HTF Order Block
HTF FVG → HTF FVG
Note Line:
Ziele zählen gemeinsam als 1 Punkt → Goals count together as 1 point
Important Note
This tool is not an automated indicator, but a visual decision aid for traders who want to apply their strategy in a structured and conscious way.

EKG Pulse +EKG Pulse – Multi-Layer Trend & Session Analyzer
Description:
EKG Pulse is an advanced trading indicator that combines trend clouds), Momentum trend flips, EMA slope detection, and session high/low tracking to give clear visual signals for intraday and swing trading. It also calculates potential trade ranges, stop-loss, and profit targets dynamically, adapting to volatility and historical session behavior.
How to Use:
Trend Identification: Use the Trend cloud and EMA slope to determine the main trend (bullish/bearish).
Trade Signals: Look for Momentum flips aligned with Trend Cloud for buy/sell signals (triangles appear on the chart).
Candle Colors: Follow Momentum-based candle coloring to visually track bullish (green) or bearish (red) momentum.
Session Ranges: Monitor session boxes and previous day’s levels for support/resistance zones.
ATR & Ticks Table: Use the table to manage risk with suggested stop-loss (SL) and multiple profit targets (TP1, TP2, TP3), scaled by your account size and instrument’s tick value.
Breakout Status: The session analyzer highlights SAFE, WAIT, or HOLD conditions based on volatility and breakout likelihood.
Benefits:
Provides multi-layer trend confirmation for safer entries.
Visual buy/sell alerts reduce guesswork.
Dynamic risk management with ATR-based SL/TP calculation.
Session boxes help identify key intraday levels.
Historical breakout analysis improves timing for breakout trades.
Works on multiple assets and timeframes with auto tick mapping.

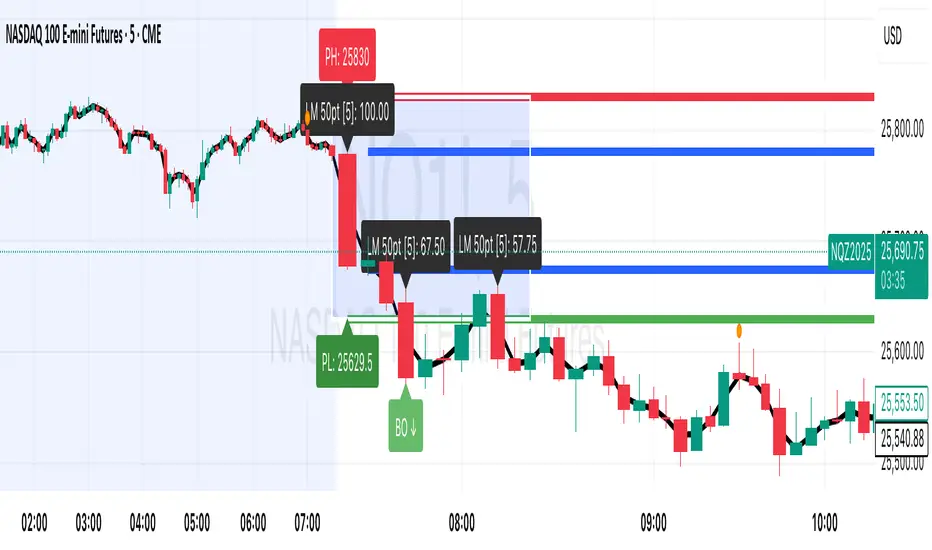
Session Breakout, Retest, Reversal + Large Move Alert# Script Description for Publication
## Script Name
**Session Breakout, Retest, Reversal + Large Move Alert**
## Short Description
A professional trading indicator that identifies session breakouts, failed retests, and large intraday price movements across any futures contract with real-time alerts and visual markers.
## Long Description
This comprehensive indicator combines session analysis with dynamic move detection, designed for active traders monitoring ES, NQ, GC, CL, and other futures contracts.
**Core Features:**
**Session Tracking:**
Automatically identifies and marks daily session breakouts and failed retests based on user-defined session times and timezones. The indicator draws visual boxes showing session highs (PH) and lows (PL), with labels marking breakout (BO) and retest failure (RF) points.
**Dynamic Large Move Detection:**
Monitors candles on any chart interval for significant price movements. The threshold is fully customizable per futures contract (default 15 points for ES/NQ/GC). When a candle closes with a move exceeding the threshold, the indicator displays a "BO" label with the exact move size and current chart timeframe.
**Real-Time Alerts:**
Triggers active alerts whenever large moves are detected, allowing traders to receive instant notifications via TradingView's alert system for timely entry or exit opportunities.
**Multi-Timeframe Compatible:**
Works seamlessly on any chart interval (1-minute through daily and beyond) without manual adjustments. The detection threshold automatically applies to the current chart's candles, with labels displaying the active timeframe.
**Universal Futures Support:**
Configurable for any futures contract by adjusting the point threshold input parameter based on each contract's typical volatility.
## Key Inputs
| Input | Default | Purpose |
|-------|---------|---------|
| Session Time | 0400-0930 | Defines trading session hours (pre-market session) |
| Session Timezone | America/New_York | Sets timezone for session detection |
| Point Move Threshold | 15.0 | Minimum point move to trigger alert (adjust per futures: ES=15, GC=15, CL=1.5) |
## How to Use
1. **Add to Chart:** Search for this indicator in TradingView and add it to your futures chart (ES, NQ, GC, CL, etc.)
2. **Configure Inputs:**
- Set session start/end times for your preferred trading session
- Adjust point threshold based on your futures contract
- Verify timezone matches your trading location
3. **Create Alerts:**
- Click "Create Alert" on the chart
- Select "Large Move Alert" from the condition dropdown
- Choose notification method (push, email, or SMS)
- Set desired frequency
4. **Monitor Moves:**
- Watch for "BO" labels appearing on confirmed candles
- Each label shows the threshold value and actual move size
- Combine with your existing trading strategy for confirmation
## Visual Elements
- **Session Box:** Blue shaded area showing session high/low range
- **PH Label:** Green label marking session high (pivot high)
- **PL Label:** Red label marking session low (pivot low)
- **BO ↑/↓ Labels:** Lime/red labels marking session breakouts
- **RF Labels:** Yellow/orange labels marking failed retests
- **Large Move Labels:** Green (bullish) or red (bearish) labels showing threshold breaches with move size
## Ideal For
- Scalpers monitoring quick intraday moves
- Day traders tracking pre-market breakouts
- Futures traders on ES, NQ, GC, CL, and other contracts
- Multi-timeframe traders watching various chart intervals simultaneously
- Alert-based automated trading systems
## Technical Details
- **Pine Script Version:** 5
- **Overlay:** Yes (displays on price chart)
- **Historical Buffer:** 5000 bars (supports 1-minute and lower timeframes)
- **Compatibility:** All futures contracts and chart intervals
## Disclaimer
This indicator is provided for educational and informational purposes only. It is not financial advice. Users should conduct their own research and consult with financial professionals before making trading decisions. Past performance does not guarantee future results.
---
AllYouNeedThis indicator provides a complete multi-session framework designed for intraday and swing traders who want to visualize key trading ranges, session structures, and market imbalances.
It automatically detects and displays:
Session zones, including customizable time ranges (e.g. 18:30–22:03, 06:00–09:00), with dynamic boxes that extend in real time.
Premium/discount and deviation levels, based on percentage or pip-based deviations, useful for identifying overextended price zones.
Fair Value Gaps (FVGs), automatically highlighted with color changes that show whether they are newly created, tapped, or broken.
Dynamic Fibonacci and standard deviation zones, projected from session highs and lows to outline potential retracement and extension areas.
Automatic labeling of key equilibrium and OTE levels, allowing traders to easily locate optimal trade entry zones.
Each visual element dynamically adapts to price action as the session unfolds, helping traders interpret structural imbalances, retracement zones, and directional bias more intuitively.
Overall, this tool offers a structured and data-driven way to map intraday price behavior, making it ideal for traders focusing on precision entries, liquidity zones, and session-based confluence.

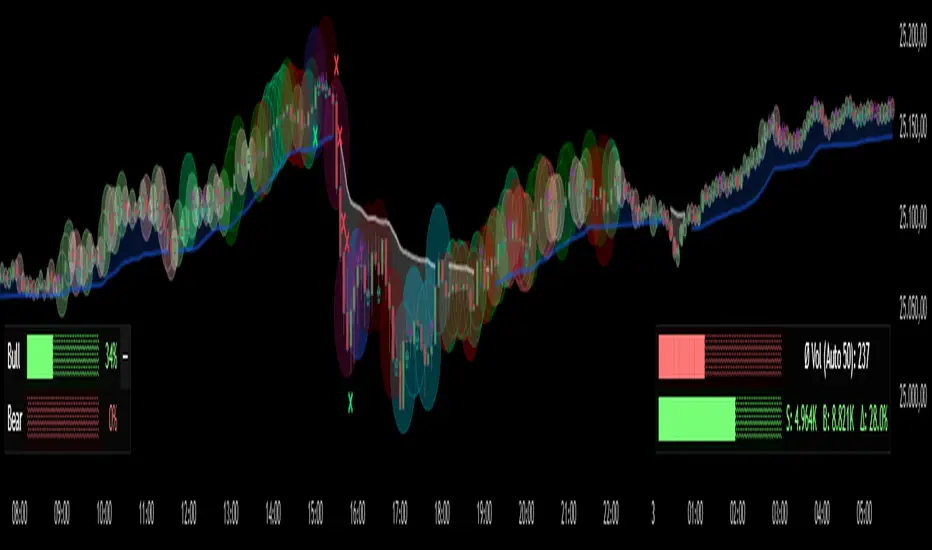
Project Pegasus ChronosDescription
Project Pegasus Chronos is the flagship volume-intelligence overlay of the Pegasus suite, built for traders who read the tape. It spots where the tape gets hit, where moves get absorbed, and when pressure flips — in real time, without repainting. Chronos blends high-signal volume spikes, absorption, pure-delta mismatches, and two crisp market-pressure HUDs into one surgical visualization that stays readable even on noisy charts.
What’s unique
Layered volume intelligence that cuts through noise: spikes, absorption, delta traps, trend bias, and pressure — at a glance.
Absorption Engine – Proprietary scoring of wick/body/delta context to flag “hit & hold” moments where moves stall.
Pure-Delta Mismatch Bubbles – Instantly reveal fake strength or weakness when the candle fights the tape.
Mirage Filters (Add-on) – Smart VolSpike & PriceClamp regime tags (squeeze vs. burst) for clean entries and exits.
Pegasus TrendDynamic – Adaptive bias band with one-look flips and optional shadow fill for context.
Dual HUDs – Buy/Sell Volume HUD and Market Pressure HUD with a Shock badge for sudden impulses.
Readable by Design – Color presets, clustering, absolute filters, and performance scopes (12/24/48/72H) keep charts fast & clean.
Non-repainting – Signals are produced only on confirmed bars; no lookahead.
How it works
Chronos aggregates recent market behavior into simple, decisive visuals:
Bubbles scale by spike tier and direction to highlight initiative participation.
Absorption marks flag bars where flow hits and fails to push through.
Pure-delta markers expose liquidity traps (delta vs. candle color).
TrendDynamic provides a smooth, adaptive bias rail.
HUDs quantify who’s pressing harder and when a shock event fires.
How to use
Stalk large bubbles near key levels; pair them with absorption marks to time fades or continuations.
Treat pure-delta mismatches as early trap signals — especially near session highs/lows or FVGs.
Trade in alignment with the TrendDynamic bias; use Market Pressure HUD & Shock to time adds or cuts.
Refine visuals via clustering and absolute-volume filters on fast instruments.
Notes & limitations
Built for intraday futures, crypto, and FX — but works across assets and timeframes.
If visuals get heavy, use scope, clustering, and filters to keep it buttery smooth.
Analysis and visualization tool — not a signal service.
Disclaimer
For educational and informational purposes only. Not financial advice.
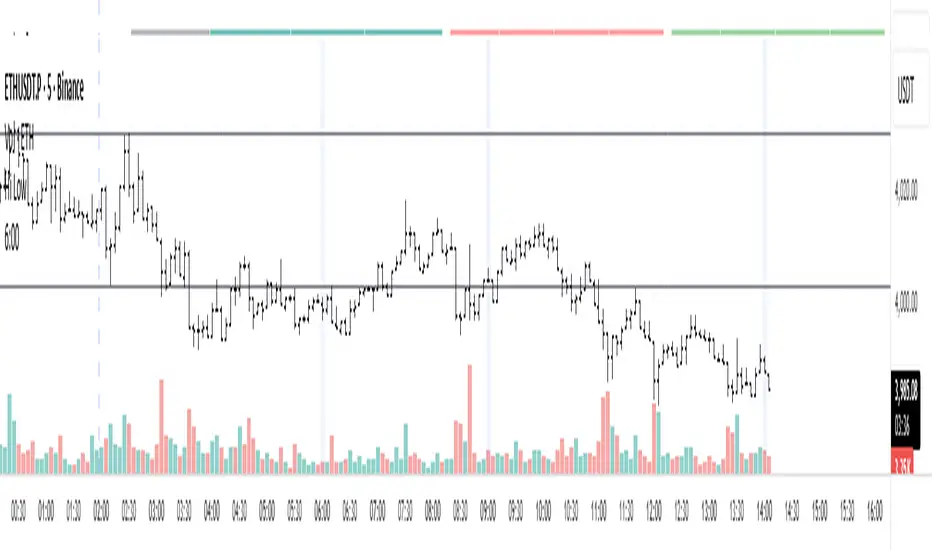
Anchored Session Volume Profile • Heatmap Profiles • Asia/EU/US Description
This indicator builds Anchored Session Volume Profiles for Asia, EU, and US sessions on intraday charts and renders them as right-docked line histograms (heatmap or classic style). Each session computes its own POC, VAH, VAL and optional Session High/Low lines. An optional per-price-bin Delta overlay estimates buy/sell pressure inside the profile rows for quick order-flow context.
What’s unique
Three independent session anchors (Asia/EU/US) with custom start/end times, bin size in ticks, and Value Area %.
Right-fixed live rendering or post-close persistence (draw levels only after the session closes).
Adaptive width: profile width scales with elapsed session length (anchor → now/end) within user limits.
Heatmap profile: row tint scales by relative volume; or Classic single-color with optional gradient.
Per-row Delta ticks (outside/inside, configurable direction) derived from bar delta and overlap with each price bin.
Clean POC/VAH/VAL line styling, optional ray extension, and Session High/Low rays per session.
How it works (technical)
Binning: Rows are built with a user-defined bin height in ticks. Arrays expand/shrink as price extends; the base is shifted when new lows appear to keep bins aligned.
Accumulation: For each bar within the active session window, traded volume is distributed to intersecting bins proportionally to the price overlap with that bin.
Value Area: POC is the highest-volume bin. VA is grown symmetrically around the POC until the selected coverage (VA%) is reached.
Delta per bin (optional): A bar-level delta proxy volume * (close − open) / range (clamped) is split into buy/sell and allocated to bins proportionally to the same overlap share, producing a per-row delta magnitude for rendering ticks.
Rendering modes:
Right fixed: refreshes each bar; lines/histogram are docked at the anchor X-position.
Draw Levels after Session Close: on close, only POC/VAH/VAL (and optional Session High/Low) are persisted.
No lookahead: All computations use confirmed bars; levels are deterministic on close.
How to use
Use the Asia/EU/US profiles to read participation hand-offs and session-driven rotations.
Trade off POC/VAH/VAL as acceptance/rejection references; confluence with session High/Low often marks responsive flows.
Employ Delta ticks per row to spot absorption, one-sided stacking, or fading participation inside the profile without leaving TradingView.
Prefer right-fixed during live trading and post-close when you want persistent session levels.
Key settings
General per session: Start/End (hh:mm), Bin size (ticks), Value Area %, toggle POC/VAH/VAL lines.
Rendering: Heatmap vs. Classic, orientation (Left/Right), gradient on/off, row thickness, right offset, adaptive width limits.
Delta (per price bin): global on/off, per-session on/off, tick width, max tick length (bars), outside/inside placement, direction (sign-based / always left / always right), colors.
Levels: POC/VAH/VAL styles (solid/dashed/dotted), widths, colors, extend right (ray).
Session High/Low: per-session on/off, style, width, colors, optional right-ray extension.
Notes & limitations
Designed for intraday data; accuracy depends on the feed’s volume granularity.
Large histories + small bins + delta ticks can be heavy; tune bin size, adaptive width, and delta max length for performance.
Timezone for anchors is set internally to Europe/Berlin.
Educational tool — not a signal generator.
Disclaimer
For educational and informational purposes only. Not financial advice.

Уровни SL/TP и значение ATR первого часаSession Range SL/TP Levels with Advanced ATR
Overview
The Session Range SL/TP Levels indicator is a comprehensive tool designed for session-based trading strategies, particularly for breakouts. It identifies the high and low of a user-defined time range (e.g., the Asian session) and uses a sophisticated, customizable Average True Range (ATR) calculation to project key Stop Loss (SL) and Take Profit (TP) levels.
This indicator helps traders visualize potential entry and exit points based on the volatility of a specific trading session, with all crucial data presented in a clean on-screen table.
Key Features
Customizable Trading Session: Define any time range to establish your core trading zone. The indicator will automatically find the high and low of this period.
Advanced ATR Calculation: The indicator uses an ATR calculated on a 5-minute timeframe for higher precision. You can customize:
The ATR length and smoothing method (RMA, SMA, EMA, WMA).
A unique percentage reduction from the ATR to create a more conservative volatility buffer.
Volatility-Based SL/TP Levels: Automatically calculates and plots multiple SL and TP levels for both long and short scenarios based on user-defined multipliers of the modified ATR.
Comprehensive On-Screen Display: A detailed on-screen table provides all critical data at a glance, including:
The original 5-min ATR value.
The modified ATR after the percentage reduction.
Three custom ATR-multiple values for quick reference.
All calculated SL and TP price levels for both Long and Short setups.
Copy-Friendly Data Logging: With a single click in the settings, you can print all calculated values into the Pine Logs panel, allowing for easy copying and pasting into other applications or trading journals.
How to Use
Define Your Session: In the settings, enter the time for the trading session you want to analyze (e.g., "0200-0300" for a part of the Asian session).
Identify the Range: The indicator will draw the high and low of this session once the time period is complete.
Plan Your Trade: The calculated levels provide potential targets for breakout trades.
For a Long Trade: If the price breaks above the session high, the green Take Profit lines (TP1, TP2, TP3) serve as potential exit points, while the Stop Loss (Long) level serves as a volatility-based stop.
For a Short Trade: If the price breaks below the session low, the red Take Profit lines serve as potential targets, with the Stop Loss (Short) level as the corresponding stop.
Reference the Table: Use the on-screen table to see the exact price levels and ATR values without needing to hover over the lines.
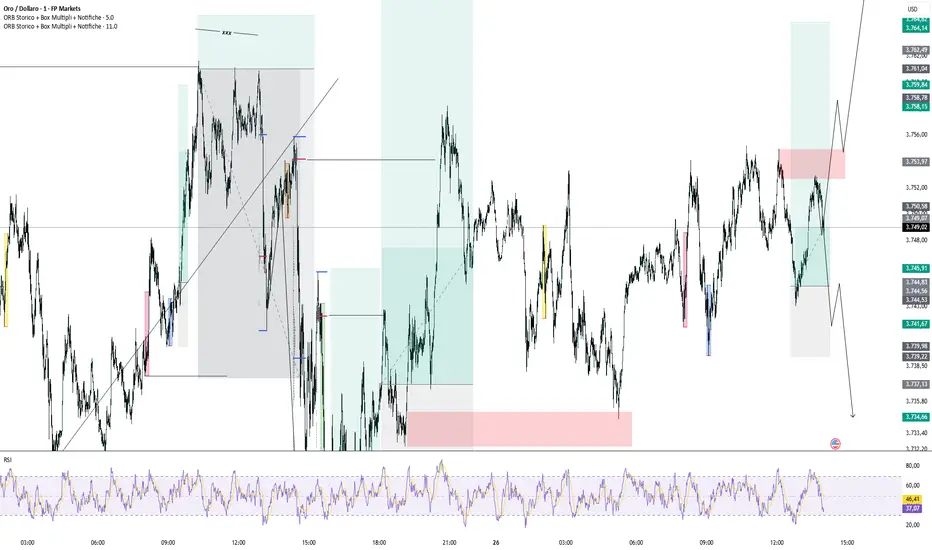
ORB Storico + Box Multipli + Notifiche🚀 “London, New York, Asia — all your ORBs in one tool.”
ORB Historic + Multiple Boxes + Alerts is a powerful indicator designed for traders who want to take advantage of the Opening Range Breakout (ORB) strategy during the major market sessions: London, New York, and Asia.
With this tool you can:
✅ Instantly identify the initial range (high and low) of each session
✅ Display historical ORB boxes directly on your chart
✅ Receive real-time alerts when price breaks above the high or below the low
✅ Customize colors, choose which sessions to display, and manage alerts easily
🎯 Why use it?
The ORB is one of the most popular intraday trading strategies. The breakout of the initial session range often provides strong and directional signals.
With this indicator, you no longer need to draw boxes or lines manually — everything is handled automatically.
⚙️ Key Features:
Configurable sessions: London, New York, Asia
Customizable box colors for each session
Dynamic support and resistance lines at session highs and lows
Automatic breakout alerts (above HIGH or below LOW)
Works on all assets and timeframes
🚀 Who is it for?
Intraday traders looking for reliable session signals
Scalpers wanting to catch early breakouts
Anyone who wants to analyze historical ORB performance with ease
👉 Add this indicator to your charts, configure your favorite sessions, and let it handle the heavy lifting.
Focus on what matters most: catching the right move at the right time.
Blitz Model
The Blitz indicator is a comprehensive market structure analysis tool designed specifically for the 4-hour timeframe. It identifies and visualizes key market movements including sweeps, fair value gaps (FVGs), and session-based liquidity levels.
1) Key Features :
A) Market Structure Analysis :
i) Sweep Detection: Identifies bullish and bearish sweeps of previous highs/lows.
ii) Double Purge Recognition: Detects when both bullish and bearish sweeps occur on the same candle.
iii) Fair Value Gap (FVG) Visualization: Displays imbalance zones with customizable box colors.
iV) Session-Based Analysis: Tracks Asian and London session highs/lows.
B) Multi-Timeframe Confirmations :
i) Layer 2 Validation System: Incorporates H1 and M15 timeframe confirmations.
ii) H1 Sweep Confirmations: Validates 4H signals with hourly sweep patterns.
iii) M15 Analysis: Includes both sweep and FVG confirmations from 15-minute timeframe.
C) Key Level Integration :
i) Daily 0.5 Level: Plots the midpoint of previous day's range with customizable styling.
ii) Session Liquidity: Identifies sweeps of Asian and London session extremes.
ii) FVG Interaction: Detects when sweeps occur near fair value gaps.
D) Customization Options :
i) Label Styling: Full control over label size, style, and colors for all signal types.
ii) Double Purge Customization: Separate styling options for double purge signals.
iii) Line Customization: Adjustable daily 0.5 line appearance (style, color, width).
iv) Display Controls: Toggle visibility for FVGs, labels, and confirmation history.
2) Technical Specifications
A) Timeframe Requirements :
i) Primary Timeframe: 4H only (indicator will show error on other timeframes).
ii) Multi-Timeframe Data: Analyzes H1 and M15 for confirmations.
iii) Session Times: Configurable start/end times.
B) Signal Validation Criteria :
Sweeps are validated when they occur at one or more of the following conditions:
i) FVG Zones: Price interaction with identified fair value gaps.
ii) Daily Midpoint: Proximity to the 50% level of previous day's range.
iii) Session Levels: Sweeps of Asian (19:00-01:00 NY) or London (02:00-05:00 NY) extremes.
C) Layer 2 Confirmation System :
i) H1 Confirmations (H1S): Sweep patterns on 1-hour charts within the 4H candle formation.
ii) M15 Sweep (M15S): 15-minute sweep confirmations.
iii) M15 FVG (M15F): 15-minute fair value gap formations.
3) Usage Guidelines :
A) Setup Instructions :
i) Apply to 4-hour charts only.
ii) Configure session times based on your analysis preferences.
iii) Customize label appearance and colors to match your chart theme.
iv) Enable/disable features based on your trading style.
B) Signal Interpretation :
i) Green Labels: Bullish sweeps with validation criteria met.
ii) Red Labels: Bearish sweeps with validation criteria met.
iii) Purple Labels: Double purge scenarios (both directions swept).
iv) Checkmark (✓): Indicates Layer 2 multi-timeframe confirmation present.
v) For double purge interpretations :
- Low & High means recent purge (just previous candle)
- Low & High means medium term purge (8H prior)
- Low & High means longer term purge (12H + prior)
4) Compatibility :
Max Objects: Supports up to 500 boxes and labels simultaneously.
5) Support & Updates :
This indicator represents educational concepts in market structure analysis. Users should thoroughly test and understand all signals before considering any practical application.
Disclaimer :
Always practice proper risk management. This is for educational purposes only and is not a financial advice.

Lanxang Pin Bar Pro V.2How to use (step-by-step)
Mark context first
Draw your Supply/Demand zones and note HTF structure (H1).
Use the indicator as a price action confirmation at those POIs.
Wait for a pin bar at a level
Bullish pin: long lower wick rejecting demand; Bearish pin: long upper wick rejecting supply.
Ensure it prints within your session and passes ATR/shape filters.
Choose your entry style
Conservative: Enter on break of pin high (bull) / low (bear).
Aggressive (RR-optimized): Place a limit near the 50% retrace of the pin bar (you removed lines, so measure the midpoint quickly: (High+Low)/2 from the data box).
Place stop
Beyond the wick + small buffer (e.g., 10–20 pts on XAUUSD M5–M15).
Keep SL reasonable (≤ ~1–1.2× ATR of your entry TF).
Targets & management
T1 = 1R, take partial, move to BE after structure break or at 1R depending on volatility.
T2 at the next opposing SD zone, prior swing, or session high/low.
Let a small runner trail via swing highs/lows if trend is strong.
Risk
Keep risk fixed % (e.g., 1%) per trade. Your math is already RR-driven—perfect for journaling and expectancy.
Recommended defaults (XAUUSD, M5–M30)
Min Wick : Body Ratio = 2.0–2.5
Max Body / Range = 0.30–0.35
Min Range as ATR multiple = 0.8–1.0
HTF = 60 min; EMAs = 50/200
Sessions = London core + NY open
Alerts
Turn on alerts for Bullish Pin Bar / Bearish Pin Bar (and optionally “Entry Trigger” if you use it).
Use them to route to your phone or EA bridge (you already use webhook flows).
Pro tips (fits your SMC style)
Prefer pins that sweep liquidity (wick pokes above equal highs / below equal lows) and close back inside your zone.
Extra confluence: FVG edge, HTF OB boundary, or daily/weekly high/low.
Skip mid-range pins with no level.
Track R results in your journal to monitor expectancy.

Longhorn Algo Session LevelsThe Longhorn Algo Session Levels indicator automatically plots key intraday reference points across the Asia, London, and Pre-Market (New York) sessions. It is designed to help traders track session-to-session order flow, liquidity grabs, and directional bias as the trading day develops.
Features
Plots highs and lows for Asia, London, and Pre-Market sessions.
Calculates and displays each session’s Line in the Sand (LIS), defined as the session’s average price.
Marks Previous Day High (PDH) and Previous Day Low (PDL) for daily context.
Session ranges reset automatically with each new trading day (18:00 EST roll).
Fully customizable colors, styles, and line widths for every level.
Labels each level directly on the chart for clear identification.
How to Use
Identify where the New York session opens relative to prior Asia, London, and Pre-Market LIS levels.
Watch for liquidity sweeps around session highs/lows.
Use LIS stacking (Asia vs London vs Pre-Market) to gauge directional bias.
This tool is especially useful for futures, forex, and indices traders who rely on session behavior to anticipate market structure and intraday momentum shifts.

Keks Key Level Fx SessionsThis script is designed to automatically plot and manage key levels for the major FX trading sessions (London, New York, and Asia). It helps traders identify the most relevant price areas that often act as support, resistance, or breakout zones during active market hours.
Key features:
Marks session highs, lows, and midpoints
Visualizes key intraday levels for better market structure analysis
Highlights potential breakout and retest areas
Works across multiple timeframes for flexibility
Clean and minimal chart design to avoid clutter
This tool is especially useful for traders who rely on session-based strategies, such as breakout trading, retests, or range trading, by providing a clear visual guide to the most important price zones.

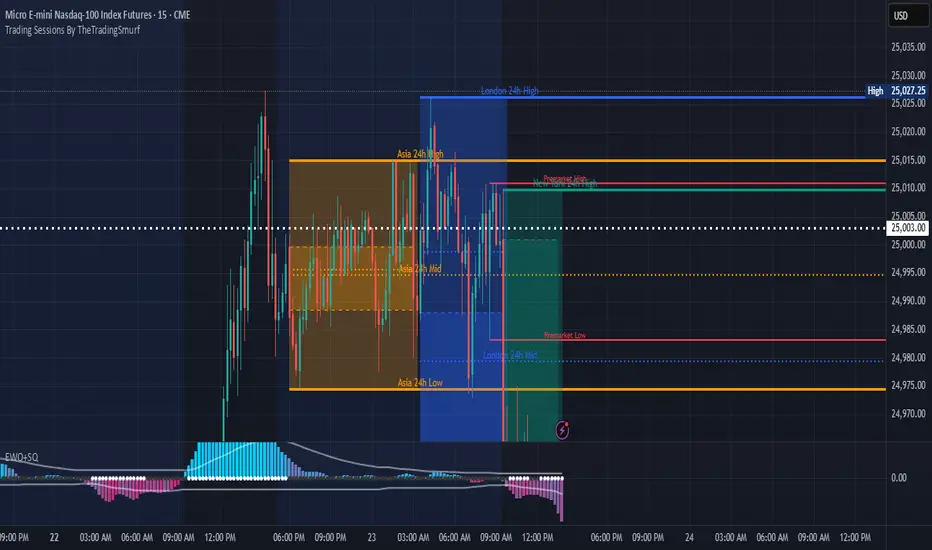
Trading Sessions By TheTradingSmurf━━━━━━━━━━━━━━━━━━━━━━━━━━━━━━━━━━━━━━
📊 Trading Sessions By TheTradingSmurf
━━━━━━━━━━━━━━━━━━━━━━━━━━━━━━━━━━━━━━
Highlights the 3 major trading sessions:
• Asia (00–09 GMT)
• London (08–17 GMT)
• New York (13–22 GMT)
━━━━━━━━━━ FEATURES ━━━━━━━━━━
✓ Shows only the last 2 sessions (48h lookback)
✓ Session High / Low / Mid lines
✓ Labels at line end with 24h / 48h tag
✓ Font colors match session colors by default
✓ Configurable line widths & extensions
✓ Optional info block (Range / Avg / High / Low / Mid)
✓ Toggle Open/Close lines, averages, and ranges
━━━━━━━━━━ DEFAULTS ━━━━━━━━━━
• Minimal view → only H/L/M lines
• Asia = Orange
• London = Blue
• New York = Green
━━━━━━━━━━━━━━━━━━━━━━━━━━━━━━━━━━━━━━
Ideal for liquidity mapping, overlap awareness,
and market structure analysis.
━━━━━━━━━━━━━━━━━━━━━━━━━━━━━━━━━━━━━━
Liquidity Sweep ReversalOverview
The Liquidity Sweep Reversal indicator is a sophisticated intraday trading tool designed to identify high-probability reversal opportunities after liquidity sweeps occur at key market levels. Based on Smart Money Concepts (SMC) and Institutional Order Flow analysis, this indicator helps traders catch market reversals when stop-loss clusters are hunted.
Key Features
🎯 Multi-Level Liquidity Analysis
Previous Day High/Low (PDH/PDL) detection
Previous Week High/Low (PWH/PWL) tracking
Session highs/lows for Asian, London, and New York markets
Real-time level validation and usage tracking
⚡ Advanced Signal Generation
CISD (Change In State of Delivery) detection algorithm
Engulfing pattern recognition at key levels
Liquidity sweep confirmation system
Directional bias filtering to avoid false signals
⏰ Kill Zone Integration
Pre-configured optimal trading windows
Asian Kill Zone (20:00-00:00 EST)
London Kill Zone (02:00-05:00 EST)
New York AM/PM Kill Zones (08:30-11:00 & 13:30-16:00 EST)
Optional kill zone-only trading mode
🛠 Customization Options
Multiple timezone support (NY, London, Tokyo, Shanghai, UTC)
Flexible HTF (Higher Time Frame) selection
Adjustable signal sensitivity
Visual customization for all levels and signals
Hide historical signals option for cleaner charts
How It Works
The indicator continuously monitors price action around key liquidity levels
When price sweeps liquidity (stop-loss hunting), it marks potential reversal zones
Confirmation signals are generated through CISD or engulfing patterns
Trade signals appear as arrows with color-coded candles for easy identification
Best Suited For
Intraday traders focusing on 1m to 15m timeframes
Smart Money Concepts (SMC) practitioners
Scalpers looking for high-probability reversal entries
Traders who understand liquidity and market structure
Usage Tips
Works best on liquid forex pairs and major indices
Combine with volume analysis for stronger confirmation
Use proper risk management - not all signals will be winners
Monitor higher timeframe bias for better accuracy
==============================================
日内流动性掠夺反向开单指标
指标简介
这是一款基于Smart Money概念(SMC)开发的高级日内交易指标,专门用于识别市场在关键价格水平扫除流动性后的反转机会。通过分析机构订单流和流动性分布,帮助交易者精准捕捉止损扫单后的市场反转点。
核心功能
多维度流动性分析
前日高低点(PDH/PDL)自动标记
前周高低点(PWH/PWL)动态跟踪
亚洲、伦敦、纽约三大交易时段高低点识别
关键位使用状态实时监控,避免重复信号
智能信号系统
CISD(Change In State of Delivery)算法检测
关键位吞没形态识别
流动性扫除确认机制
方向过滤系统,大幅降低虚假信号
黄金交易时段
内置Kill Zone时间窗口
支持亚洲、伦敦、纽约AM/PM四个黄金时段
可选择仅在Kill Zone内交易
时区智能切换,全球交易者适用
个性化设置
支持多时区切换(纽约/伦敦/东京/上海/UTC)
HTF周期自动适配或手动选择
信号灵敏度可调
所有图表元素均可自定义样式
历史信号隐藏功能,保持图表整洁
适用人群
日内短线交易者(1分钟-15分钟)
SMC交易体系践行者
追求高胜率反转入场的投机者
理解流动性和市场结构的专业交易者
使用建议
推荐用于主流加密货币、外汇对和股指期货
配合成交量分析效果更佳
严格止损,理性对待每个信号
关注更高时间框架的趋势方向
风险提示: 任何技术指标都不能保证100%准确,请结合自己的交易系统和风险管理使用。
